Gilbert Odyssey - Data visualisation with React/Node.js
Gilbert Odyssey is an interactive visualisation of the 5 Monuments of cycling
Named after Philippe Gilbert, whose dedication for winning all Monuments is outstanding.
One last Monument win with Milan-Sanremo would make him join the elite club of Rik Van Looy,
Eddy Merckx and Roger de Vlaeminck.
This is my first web app done with React/Node.js.
Try it here
Motivation
After a couple of years busy working on low-level programming (5G base station antenna), I wanted to get back into
web development. I have always been interested by maps for data visualisation. In France, we’ve got a popular tv show
called “Le dessous des cartes” which explains geopolitics only by showing map visualisation. I guess I always wanted to
do something similar. Cycling being one of my favorite sports, I decided I could do a map visualisation in that domain.
The first question was to find which data to visualise. I thought I could do something about summarising cyclists victories in
all popular classics and Grand Tours. Unfortunately I looked for free/open databases, but couldn’t find any. I would have to create my own database. So I decided to narrow my expectations and focus on the 5 biggest classics races: the 5 Monuments.
Features
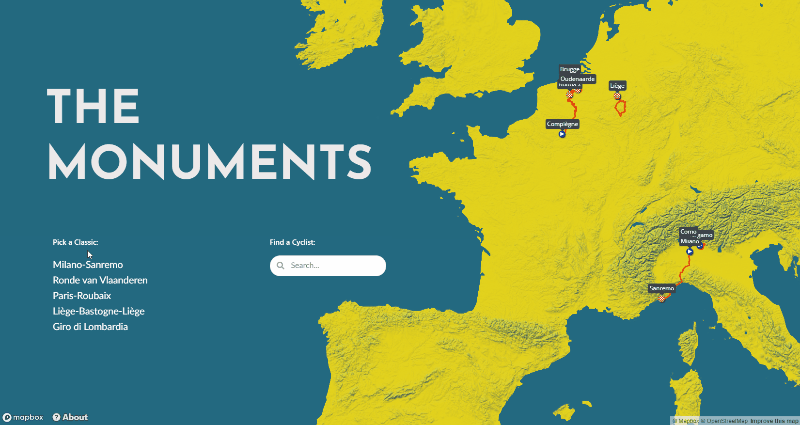
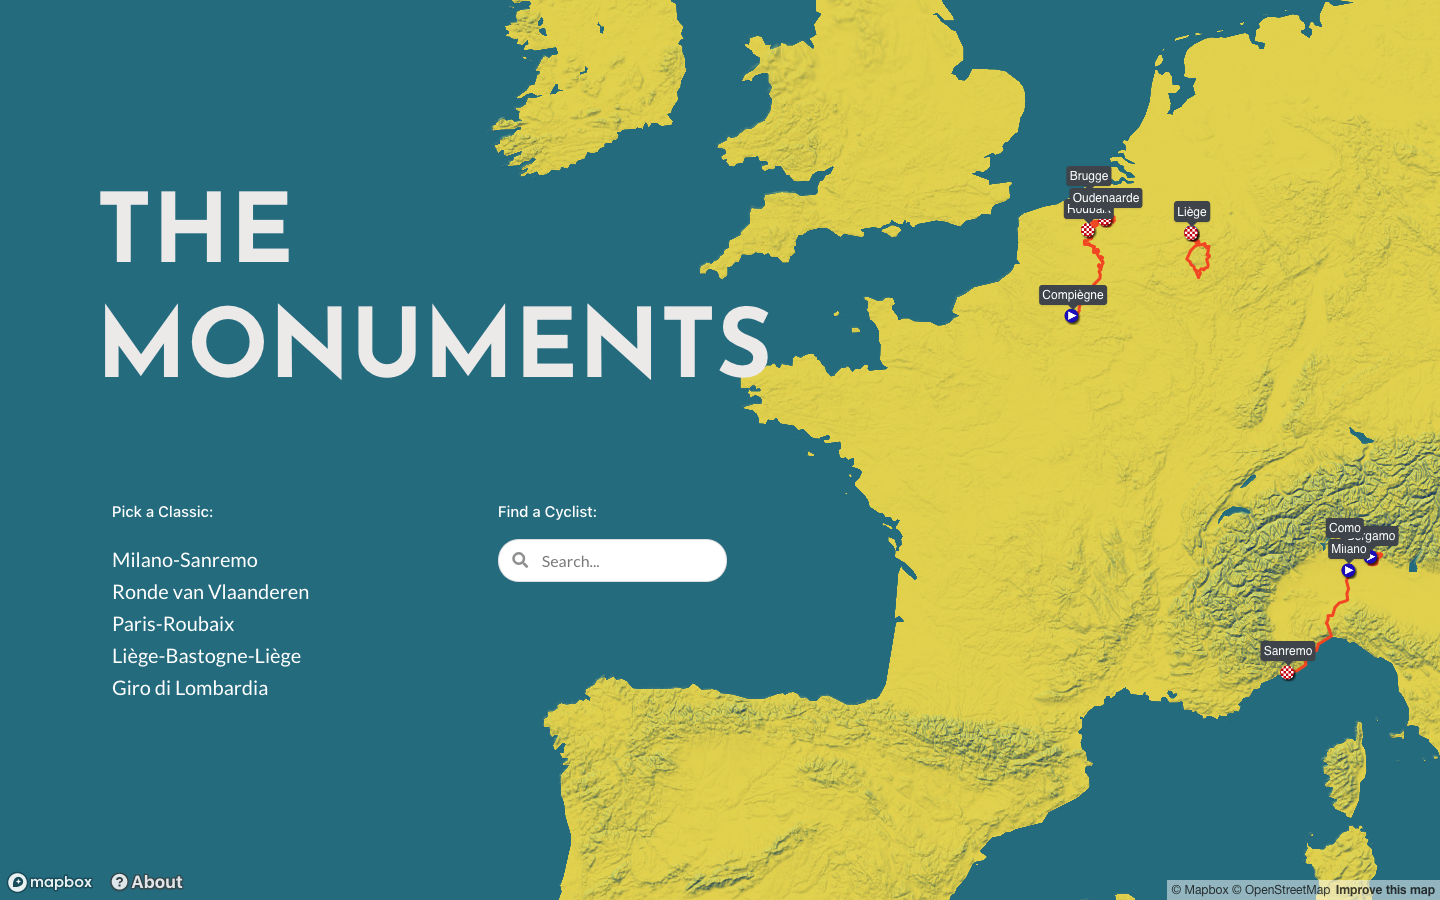 On the Home view, you can see the focus on the map. It shows the 5 Monument races, and asks the user to choose a race or search for a cyclist. You can also use the map and click on a race.
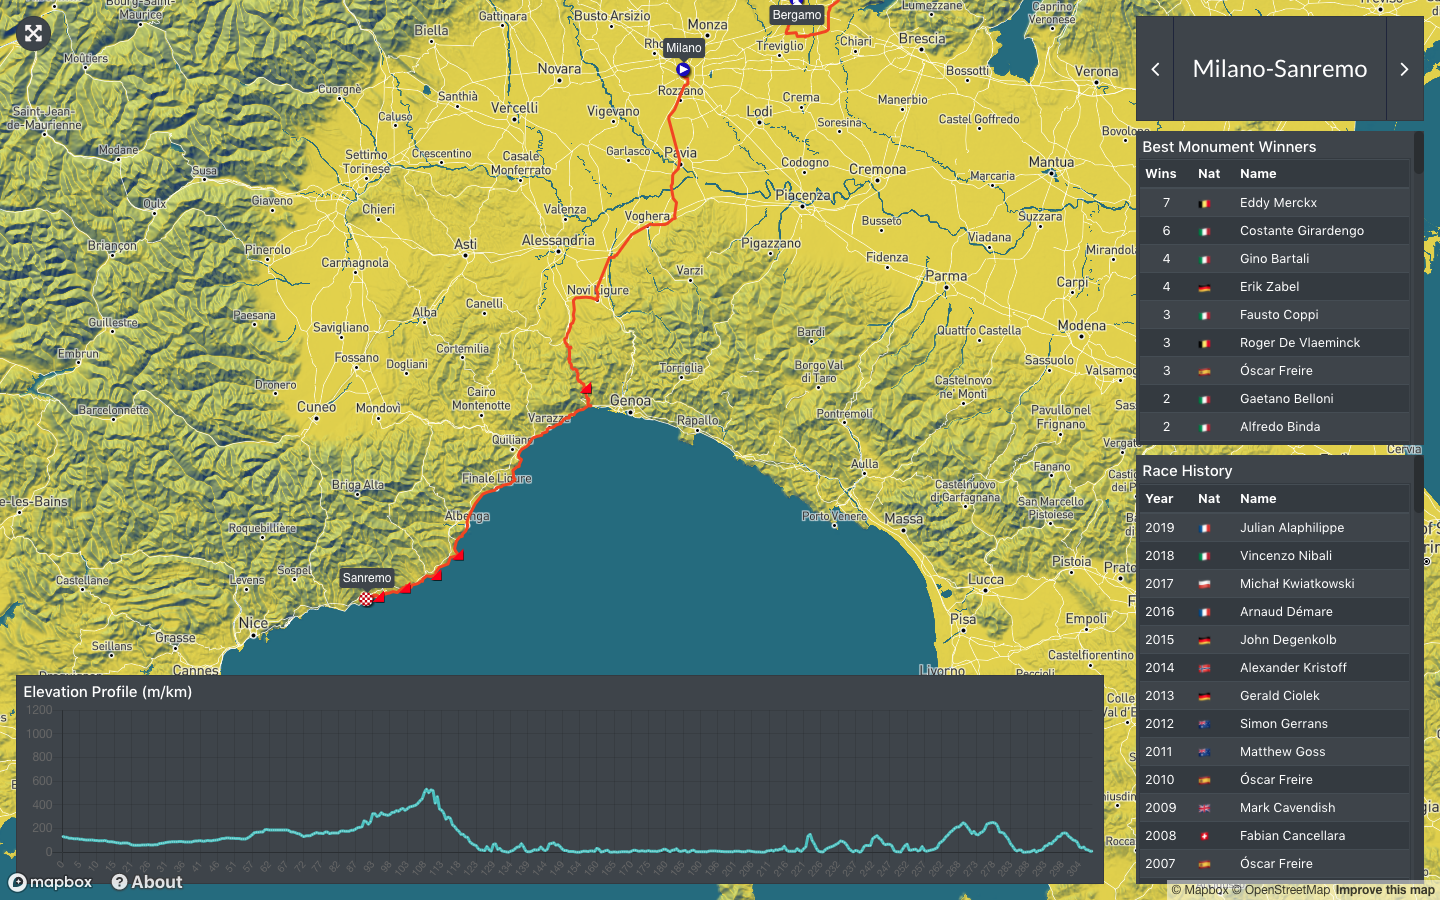 There are 2 main views, the Race view and the Cyclist view. The Race view zooms on the race and the interface shows data about the overall best winners, the full history and the elevation profile. From then you can click towards another race with the arrows, or click on a cyclist name.
 The Cyclist view shows a picture of the cyclist, its Monument wins and a summary of its wins with icons you can click on, that bring different color for better visualisation. From then you can click on a race name or search for another cyclist through the search box.
There is a About icon at the bottom that brings a pop-up for information about the app, and a link the github repo. There is also a FullScreen icon, that allows to see the map in full screen and interract with it.
Development Stack
This project was also a chance for me to learn new technologies. My main focus was on React, which I really liked. Not all the technologies I used were necessary for a project of this size, the true reason being about practising them.
- App created with the popular node module Create-React-App
- Added back end with node.js and Express framework
- Database created with MongoDB and populated manually
- The main component of my app is the map. I used Mapbox as I already tried it and like the design platform, and Mapbox-Gl-JS for the javascript library that uses WebGL for rendering
Focus on React
The main part of the work being done on this web app was on the front end, as there is no interaction with the database after startup.
I used React class components and discovered lifecycle methods. The map being the main component, I wanted it to always be full screen. I then added the user interface above it. So I have 2 components using full screen and that need to interract between themself.
That design choice leaded me to 2 problems
- I discovered the joy of render props, the old way of sharing code between React components. I could have used Redux or even Context, but using render props allowed me to deeply understand the source of the problem
- Css styling is a nightmare when you have 2 components taking full screen and you have to be sure the 1 above doesn’t hide key elements in the 1 below. Specially with a responsive layout. That’s also why I needed to add a full screen icon, that actually removes the user interface, otherwise you can’t interract with the map
Conclusion
I really enjoyed this project and specially React. I understand now why it became so popular. I already have some plans for using it in another project. This time I would use React hooks as I understand its benefits and I wouldn’t face some of the problems I met here. I also want to use TypeScript, open data and more stuff going on the back end/database.
Smartphone Screenshots
Home page

Race view

Cyclist view
